On this page
Modern distributed systems are complex. The days of simply checking CPU load are over. Observability, built on the three pillars—Logs, Metrics, and Traces—is essential for understanding system health, debugging issues, and ensuring reliability at scale.
1. The Three Pillars of Observability
Observability is a measure of how well you can infer the internal state of a system from its external outputs. These three data types provide the complete picture.
Metrics
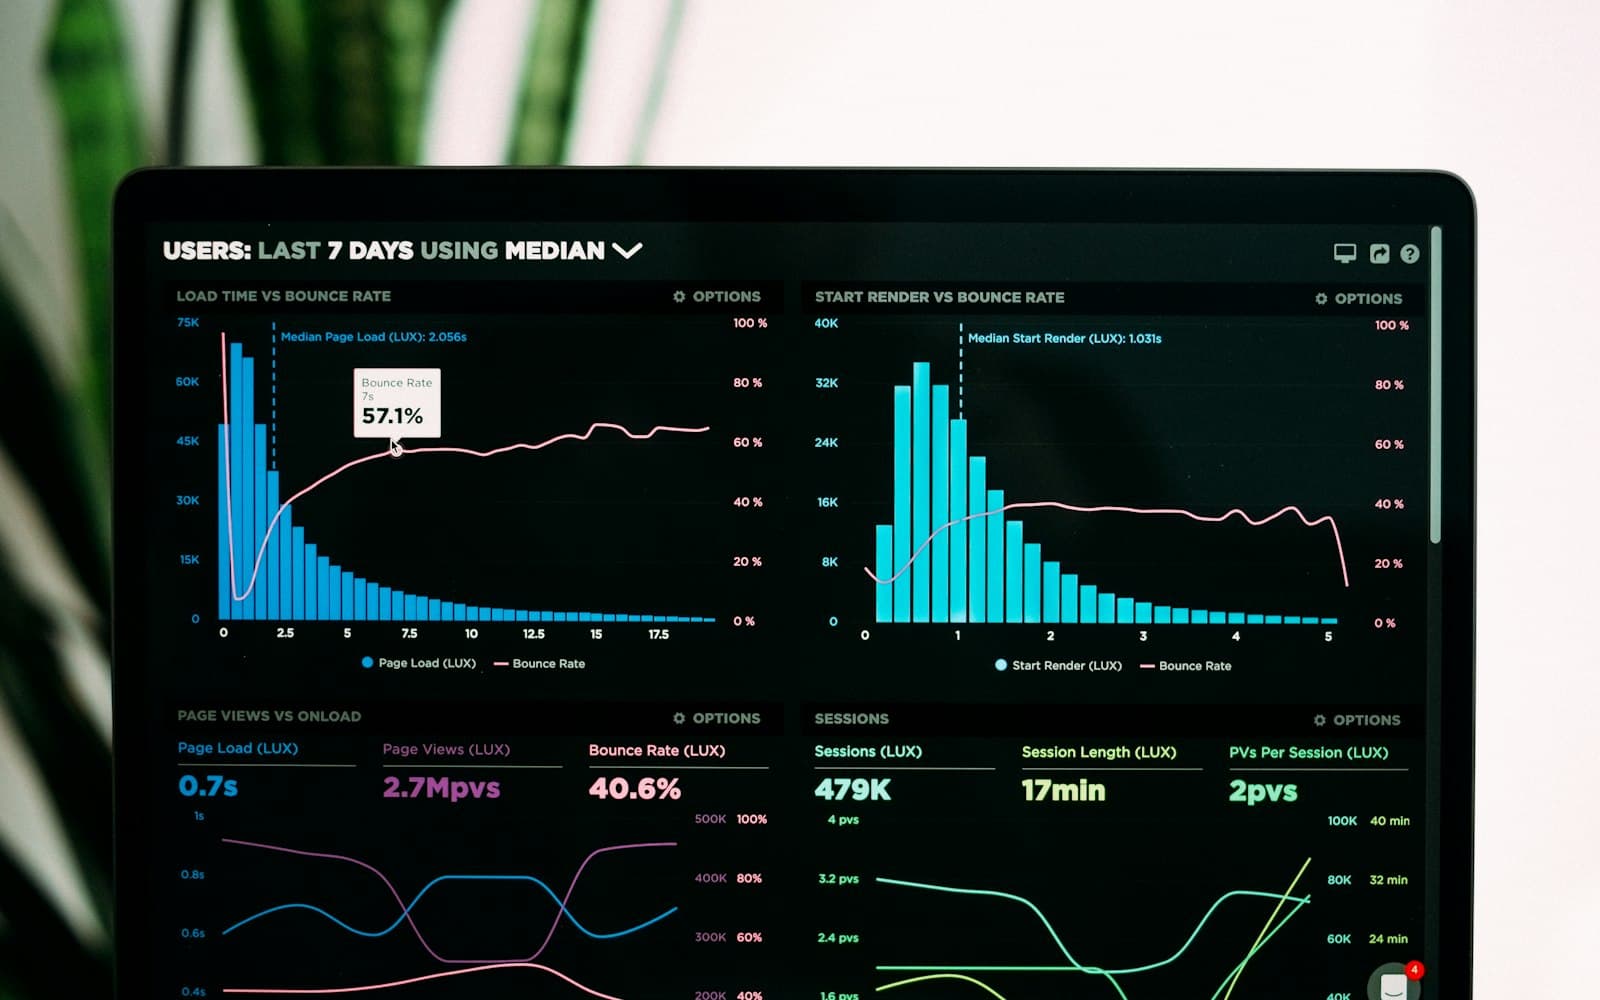
Numerical data points aggregated over time (e.g., CPU utilization, request latency). Best for alerting and dashboarding.
Logs
Discrete, timestamped events describing what happened at a specific point in time. Best for debugging individual failures.
Traces
Representation of a single request's journey across multiple services. Best for profiling and understanding microservice dependencies.
2. Metrics: Time Series and Aggregation
Metrics are the first line of defense. Use Prometheus or similar systems for time-series collection.
Types of Metrics (Gauges, Counters, Histograms)
Understand the difference: Counters for increasing values (requests served), Gauges for current state (queue size), and Histograms/Summaries for statistical distribution (latency).
The RED Method
Monitor Rate (requests/sec), Errors (failed requests/sec), and Duration (latency) for all services to ensure comprehensive coverage.
3. Logs: Structured Logging for Searchability
Unstructured log lines are useless at scale. Implement structured logging across all applications.
4. Traces: Following the Request Path
Distributed tracing is critical for microservices. Use standards like OpenTelemetry to instrument your applications.
Span Context and Propagation
A trace is a tree of spans. Ensure the trace context is passed correctly via HTTP headers between all services.
Identifying Bottlenecks
Tracing allows you to pinpoint which service or database call contributes most to the end-to-end latency of a request.
Conclusion
True observability is a cultural shift, not just a tool deployment. By consistently gathering and analyzing logs, metrics, and traces, teams gain the deep insights necessary to proactively address failures and continuously improve system performance.